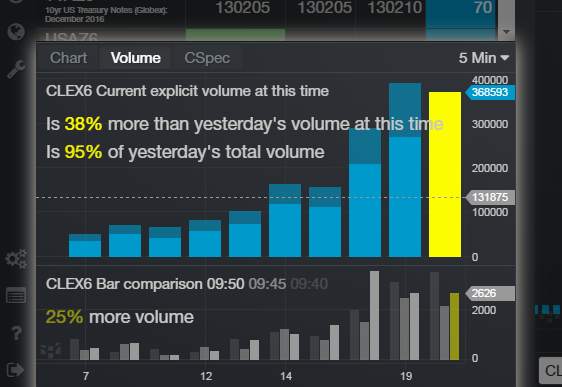
The innovative technical analysis tool, the Volume Comparison Widget, is now available as a standalone widget. Access it from the left bar--> Chart --> Volume.
What is it and why is it helpful? Dual-axis volume comparison
Consolidating volume information provides greater market transparency by employing several volume studies into a single infographic (mobile and desktop).
- Beyond a standard volume histogram, this gives you insight as to how the market is behaving compared to previous days in two ways: Compared to the same time period in previous days
- Compared to previous time periods today and in previous days
This dual-axis comparison enables you to see how the market is evolving in a more granular way rather than traditional volume histograms on a chart.


